

Performance and Resiliency: Graid SupremeRAID for AI and HPC Workloads
 By Pho Tue SoftWare Solutions JSC
- In the Lab
- 04/09/2024
- 8 minutes read
- 8,829 Views
Graid Technology’s SupremeRAID continues redefining the storage landscape by setting new data protection and performance standards, particularly for modern workloads such as AI and High-Performance Computing (HPC). Traditional RAID configurations often struggle to meet the demands of these data-intensive environments, especially when reliant on hardware RAID cards constrained by the limitations of
In advanced workloads like AI and HPC, alternative configurations such as JBOD (Just a Bunch of Disks) and software RAID (mdadm) are also commonly employed. While practical when coupled with checkpointing to prevent data loss, JBOD introduces more points of failure and burdens IT administrators with challenging recovery processes. Software RAID offers data resiliency but drains valuable CPU resources to manage RAID parity data and underperforms in many areas. In contrast, Graid’s SupremeRAID provides a streamlined, high-performance solution that simplifies data management without compromising speed or reliability.
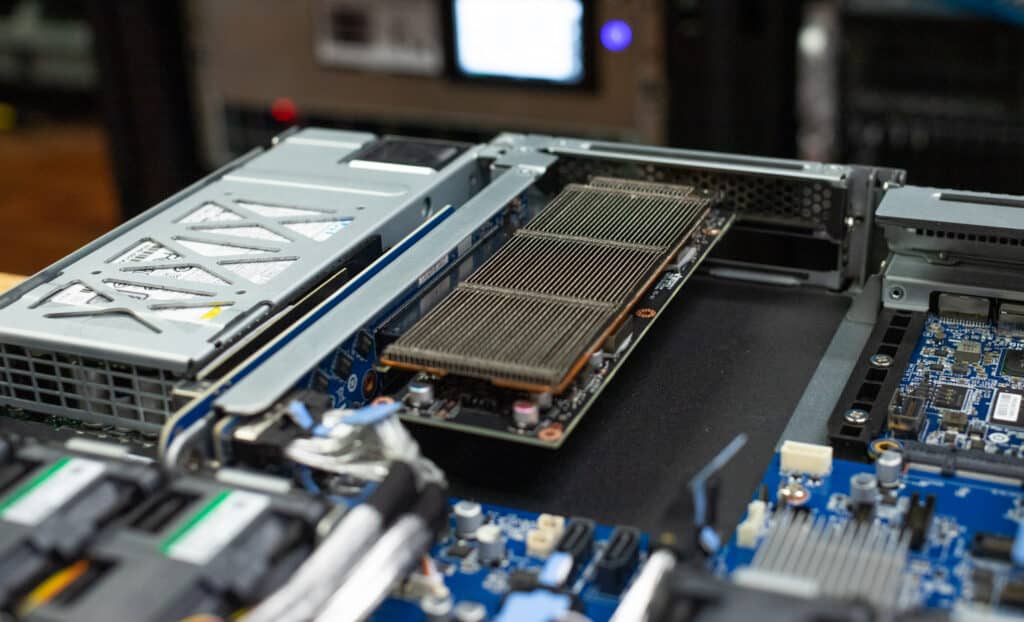
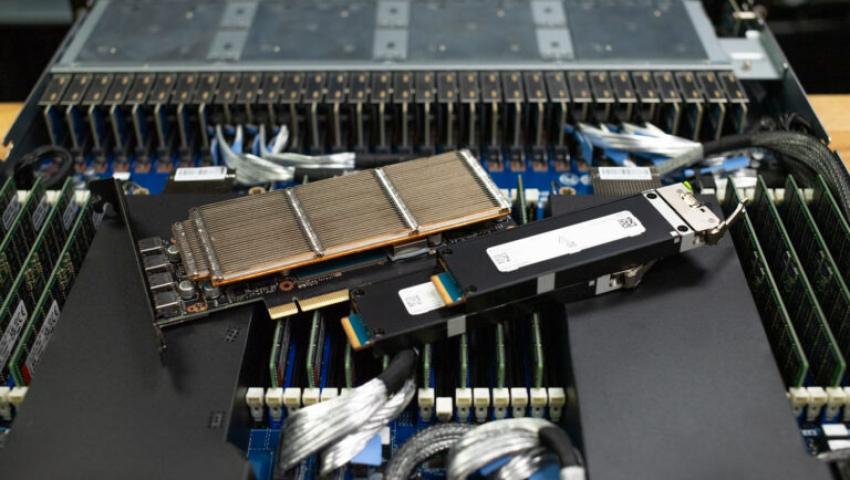
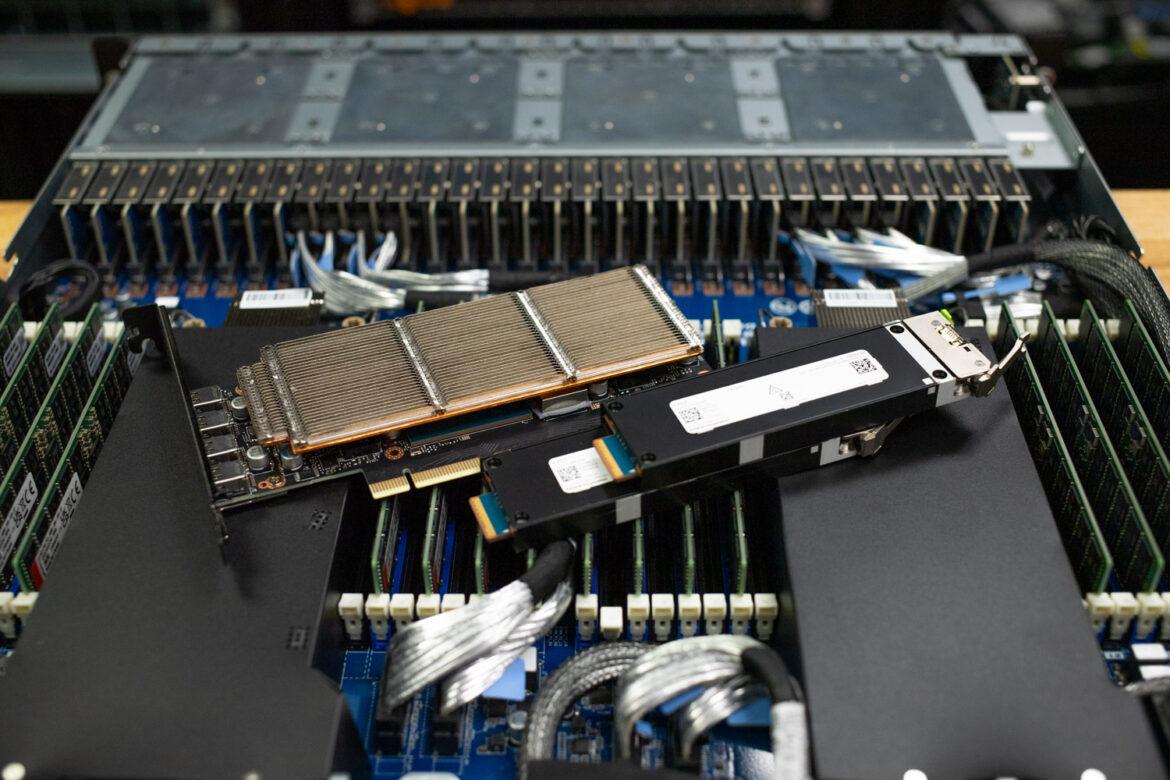
Graid SupremeRAID Card
This paper will explore a performance comparison between Graid’s SupremeRAID, JBOD, and software RAID, illustrating why Graid emerges as the superior choice for IT environments where performance and data protection are paramount.
Performance Testbed
We used the Gigabyte S183-SH0-AAV1 dual Intel 5th Gen Scalable 1U server for this test bed. We wanted to find a compact server with plenty of computing power, and it just so happened that the server supports 32 E1.S SSDs, the maximum of what is supported with a single Graid SupremeRAID SR-1010. The Gigabyte server has 32 DIMM slots, with 96GB RDIMM and 256GB 3DS RDIMM support. This platform offers three FHHL PCIe Gen5 slots in the rear, giving plenty of options for high-speed networking connectivity. In addition, the motherboard provides dual 1GbE onboard networking and a 1GbE management port.
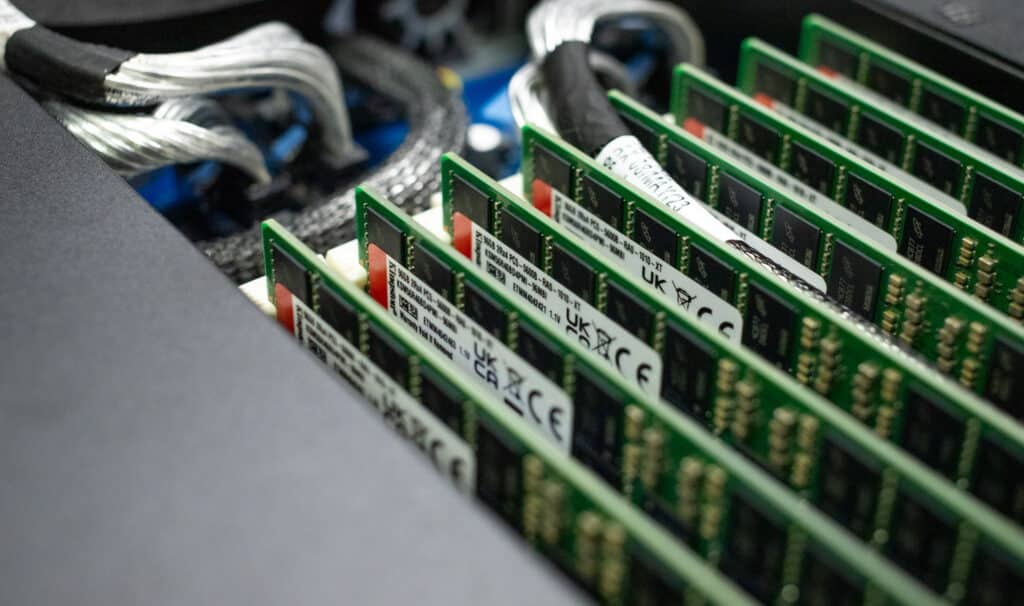
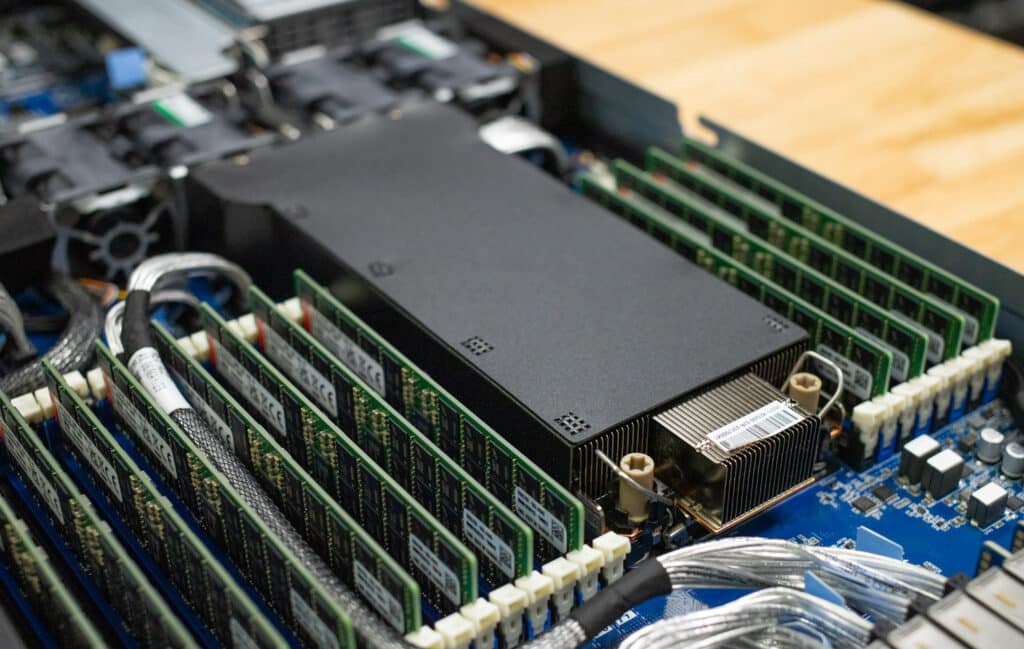
Kingston 96GB DDR5-5600 ECC RDIMM
The server supports 32 DIMM slots, but in this case, we populated with 16 Kingston DIMMs, 1 DIMM per channel (1DPC) for maximum DRAM speed. Should the workload call for a larger footprint, moving to higher-density DIMMs or a 2DPC configuration is possible, but the latter drops DRAM speed to 4400MT/s. The Kingston 96GB DDR5-5600 ECC RDIMMs in this server provide an excellent blend of performance per dollar, making them an attractive option for workloads needing high-speed DRAM and a reasonable DRAM footprint without the cost premium of 128GB DIMMs. These modules offer the best of both worlds for intensive HPC and AI workloads.
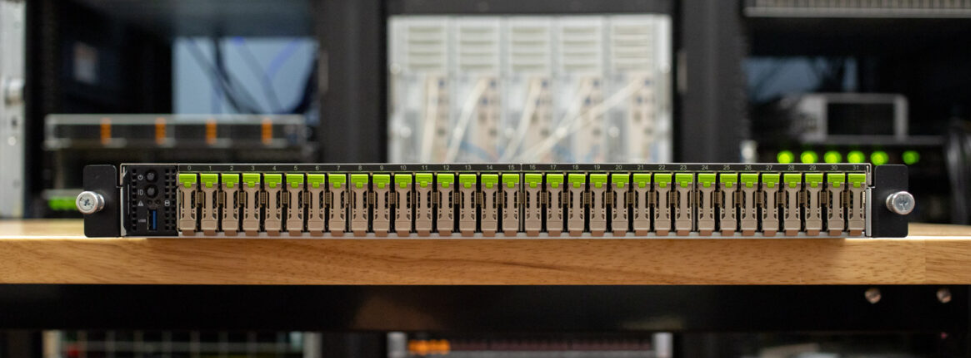
KIOXIA 7.68TB XD7P SSDs
The 32 E1.S SSD bays are populated by KIOXIA 7.68TB XD7P SSDs. The drives use a PCIe Gen4 x2 interface and deliver a maximum bandwidth of 7.2GB/s read and 4.8GB/s write. KIOXIA has designed these drives specifically for intensive hyperscale and HPC workloads, where the density advantages of E1.S SSDs are beneficial. Importantly, KIOXIA has ensured the thermal design of the XD7P is ready to keep up with this dense server design, even under heavy load.
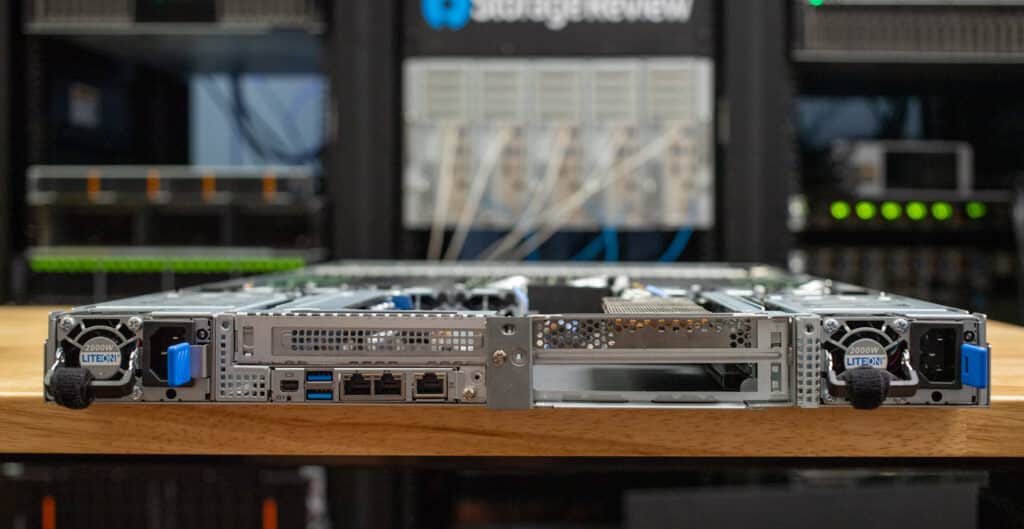
Gigabyte S183-SH0-AAV1 Server Rear I/O
Test System Specifications
- Gigabyte S183-SH0-AAV1 Server
- 2 x Intel Xeon Platinum 8592+ CPUs (64 core, 1.9GHz)
- 16 x 96GB Kingston DDR5-5600
- 32 x KIOXIA XD7P 7.68TB E1.S SSDs
- Graid SupremeRAID SR-1010
- Ubuntu 22.04.4 Server
Performance Testing Results
HPC workloads can operate for days, weeks, or months at a time, and without resilient backend storage, a single drive failure can force these jobs back to square one. To evaluate Graid’s impact on both resiliency and performance for HPC and Ai workloads, we look at the performance of y-cruncher’s internal storage benchmark. The goal is to compare a variety of storage configurations, JBOD, software RAID, and Graid SupremeRAID, to understand their impact on CPU-intensive workloads.
RAID Configuration
We know that mdadm software RAID sees a substantial write hit for parity data. While RAID10 would achieve higher performance, it would also significantly reduce the usable capacity. To best optimize the software RAID5 performance, we configured two RAID5 pools, split across SSDs 0-15 and 16-31. This balanced them across both CPUs.
The Graid comparison was also tuned to use two RAID5 pools, with an even split of half the SSDs on CPU0 and the other half on CPU1 for NUMA balancing. We tested with a single volume on each RAID5 pool as well as two volumes per RAID5 pool.
Each drive is individually mapped in the JBOD configuration, ensuring even NUMA balancing.
We could not include hardware RAID in this report as the way the drives are cabled in this server makes traditional hardware RIAD cards unsupported. It’s worth noting, however, that even if we could, the best-case scenario would be hitting the bandwidth limit of a PCIe Gen4 x16 slot for a single card, around 28GB/s.
Software Configuration
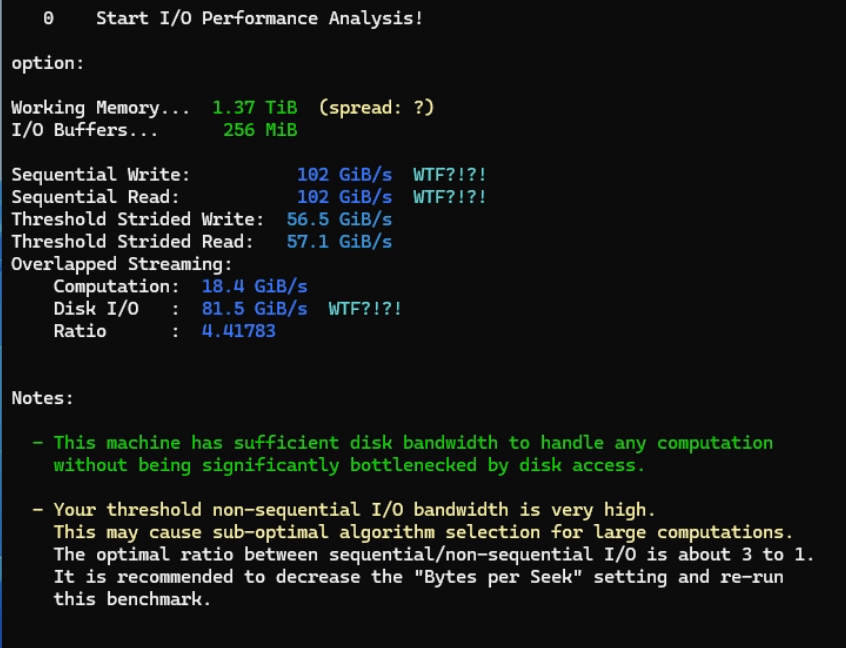
For these various storage scenarios, we used y-cruncher‘s internal performance testing tool. The test results are divided into sequential read and write performance, computation I/O speed, disk I/O speed, and the ratio of disk I/O speed to computation speed. We selected this tool because it simultaneously stresses the CPU, memory, and drive I/O. Although it doesn’t represent any single specific workload, we’ve found that the data it generates closely correlates with overall system performance under I/O-heavy applications. Notably, the I/O test includes actual data processing rather than just pushing bits through an interface as quickly as possible, making it a more accurate reflection of system performance under real-world load.
Sequential read and write performance indicates the raw speed of the disk array. Computation speed is the rate at which the CPU works through data, while disk I/O speed is how fast data can stream to the CPU as computation work occurs. Workloads going to disk need the disk I/O speed higher than the computation speed not to get slowed down. If this ratio is less than 1.0, the disk is a bottleneck, whereas over 1.0, the CPU is a bottleneck. y-cruncher for large workloads performs best when the ratio is 2.0 or higher.
| Storage Configuration | Sequential Read GB/s | Sequential Write GB/s | Computation GB/s | Disk I/O GB/s | Ratio |
|---|---|---|---|---|---|
| Direct JBOD | 102 | 102 | 18.4 | 81.5 | 4.42 |
| Graid RAID5 x 2 2VD | 64.3 | 43.8 | 23.1 | 70.4 | 3.05 |
| Graid RAID5 x 2 4VD | 85.2 | 73.7 | 22.1 | 69.4 | 3.14 |
| SW RAID5 x 2 | 122 | 3.6 | 25.7 | 10.9 | 0.42 |
With direct JBOD to 32 individual E1.S SSDs, y-cruncher saw a performance of 102GB/s read, and 102GB/s write with its internal striping process. This is generally the highest performance y-cruncher will see for this platform, although the trade-off is no data parity. When the configuration was switched to software RAID5 volumes (spread across both CPUs) with mdadm, sequential performance plummeted to just 3.6GB/s write and 122GB/s read. Graid with two RAID5 pools and two volumes measured 64.3Gb/s read with write performance at 43.8GB/s. Splitting that into two RAID5 pools but with four volumes Graid saw an increase in bandwidth to 85.2GB/s read and 73.7GB/s write.
With the bandwidth numbers addressed and the spectrum of storage configuration options understood, we drill into the impact of this decision on the application. The ratio of computation to disk I/O bandwidth saw the highest ratio of 4.43 from the JBOD configuration. Software RAID5 was a paltry 0.42, while Graid RAID5 3.05 with 2VDs and 3.14 with 4VDs.
In this y-cruncher example, which includes all performance capabilities of the server, a ratio of 2.0 or higher is required for optimal performance. While the JBOD configuration nets the best overall results, it does so at the cost of parity data, meaning a failure of any drive, even for a moment, means data loss. On the other hand, software RAID can offer data availability and a higher read speed than JBOD, but the writes suffer so severely that the disk I/O cannot keep pace with the CPU, netting the dreadful .42 result.
Those two data points are critical to understanding the benefit Graid SupremeRAID offers these workloads. For this use case, the aggregate performance numbers lie between JBOD and software RAID, but raw I/O is not the complete story. This example shows that Graid can deliver more than the required application performance while also providing data availability. This combination means organizations using Graid can expect RAID protection, storage, and application performance with a non-blocking architecture far exceeding what a traditional RAID card could provide.
Conclusion
Graid Technology’s SupremeRAID consistently pushes the boundaries of data protection and performance, setting a new standard in the industry. By harnessing the power of GPU acceleration, Graid delivers unmatched speed and efficiency in RAID configurations, significantly reducing CPU strain while maximizing throughput.
The data we collected for this report demonstrates Graid’s ability to ensure robust data protection while meeting the demanding requirements of modern AI and HPC workloads—areas where traditional RAID and software RAID solutions often fall short. This efficiency allows critical system resources like the CPU, DRAM, and storage to fully contribute to the performance of the applications they are designed to support, enhancing overall system value and effectiveness.
This report is sponsored by Graid Technology. All views and opinions expressed in this report are based on our unbiased view of the product(s) under consideration.
Pho Tue SoftWare Solutions JSC
Pho Tue SoftWare Solutions JSC là Nhà Cung cấp dịch Trung Tâm Dữ Liệu, Điện Toán Đám Mây Và Phát Triển Phần Mềm Hàng Đầu Việt Nam. Hệ Thống Data Center Đáp Ứng Mọi Nhu Cầu Với Kết Nối Internet Nhanh, Băng Thông Lớn, Uptime Lên Đến 99,99% Theo Tiêu Chuẩn TIER III-TIA 942.
Để lại bình luận
Địa chỉ email của bạn sẽ không được công khai. Các trường bắt buộc được đánh dấu *