

Dell PowerEdge C6615 Server Review
 By Pho Tue SoftWare Solutions JSC
- Tin Khuyến Mãi
- 02/08/2024
- 12 minutes read
- 10,286 Views
The Dell PowerEdge C-Series platform has a 2U chassis supporting four servers inside the Dell Modular Infrastructure category. Depending on the workload, the C-series system can be configured with two different node types: an AMD single-socket C6615 node or an Intel dual-socket C6620 node.
Our review will focus on the C-series chassis, which has four single-socket AMD EPYC nodes connected to an 8-bay E3.S PCIe Gen5 drive backplane.
From a storage perspective, the platform can be set up with a 2.5″ SFF drive backplane, which supports up to 24 NVMe SSDs or Gen5 support leveraging an 8-bay E3.S backplane. Internally, these drives are connected to each node directly, with an even split across the four servers. For instance, in the 24-bay configuration, each node sees six drives; in the 8-bay setup, each node sees two drives.
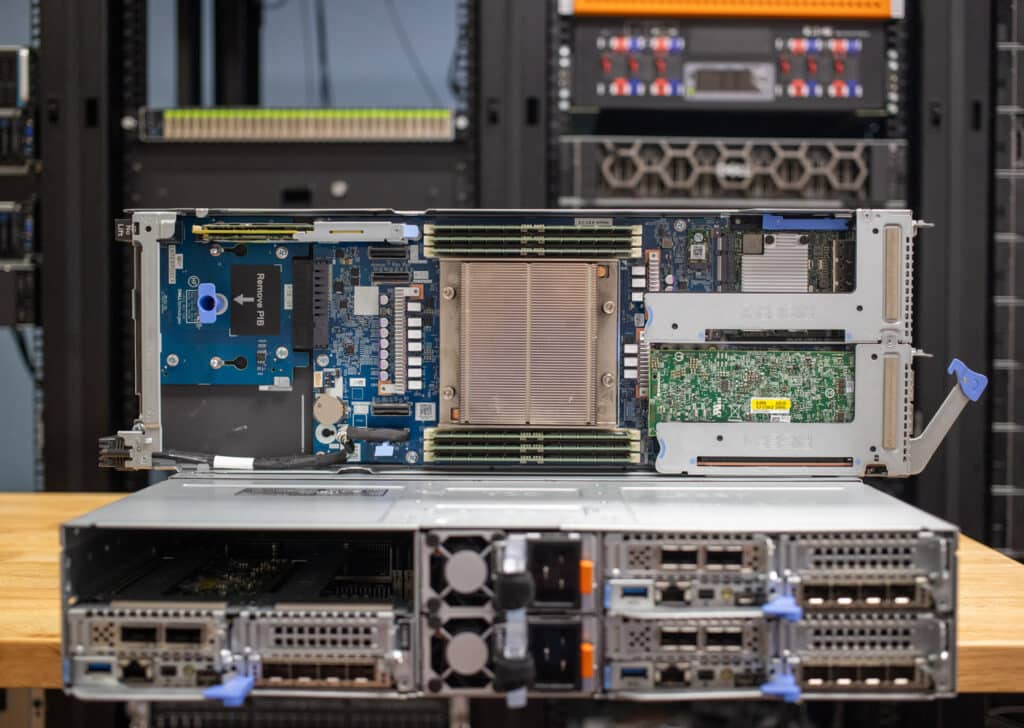
The C6600 chassis offers shared redundant power supplies and cooling for the four nodes installed, although, beyond that, each node is independently managed. So, unlike a managed blade chassis with a chassis management portal, this is more like four small PowerEdge servers under one metal roof. Each C6615 node has dedicated networking connections, an iDRAC interface, and PCIe slots for expansion.
Dell PowerEdge C6615 Node Specifications
C6615 Specifications | |
|---|---|
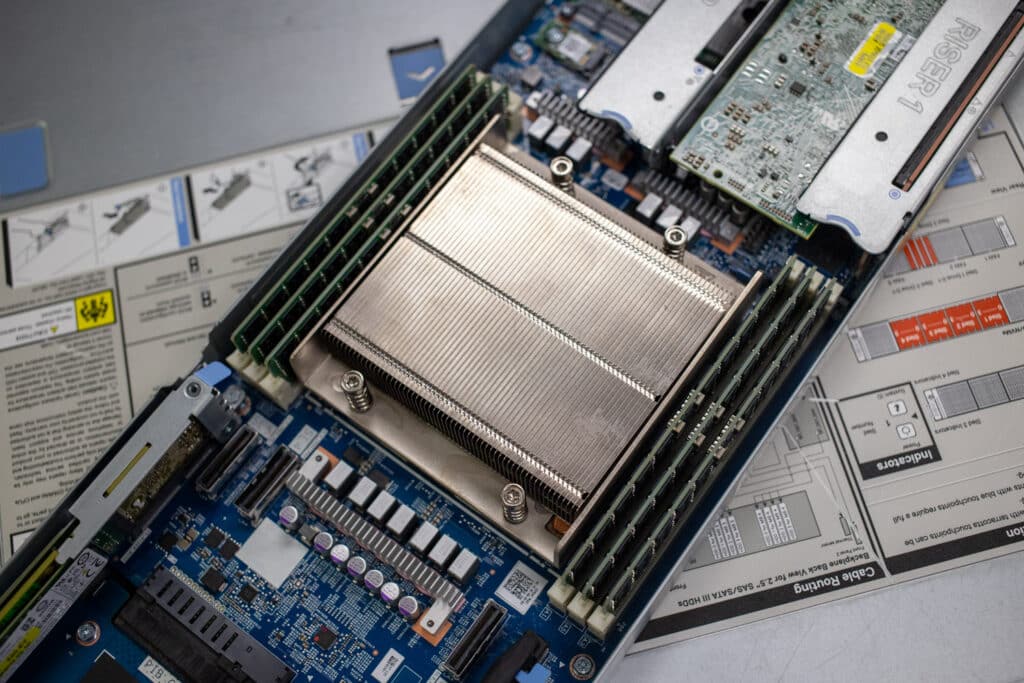
| Processor | One AMD EPYC processor with up to 64 cores |
| Memory | 6 DDR5 DIMM slots, supports RDIMM of 576 GB (6 x 96 GB) max, speeds up to 4800 MT/s |
| Storage Controllers | Internal controllers (RAID): PERC H755N, PERC H355 Internal Boot: Boot Optimized Storage Subsystem (NVMe BOSS-N1): HWRAID 1, 2 x M.2 SSDs Internal 12 Gbps SAS HBAs (non-RAID): HBA355i Software RAID: S160 |
| Availability | Hot-plug redundant drives and PSUs |
| Drive Bays | Front bays: Up to 16 x 2.5-inch SAS/SATA (HDD/SSD) drives max 61 TB Up to 16 x 2.5-inch SATA/NVMe drives max 15.36 TB on Universal Backplane configuration Up to 16 x 2.5-inch on NVMe backplane Up to 8 x E3.s on NVMe SSDs hard drive backplane |
| Hot swap, Redundant Power Supplies | 3200W 277 VAC or 336 VDC 2800W Titanium 200-240 VAC or 240 VDC 2400W Platinum 100-240 VAC or 240 VDC 1800W Titanium 200-240 VAC or 240 VDC |
| Dimensions | Height – 40.0 mm (1.57 inches) Width – 174.4 mm (6.86 inches) Depth – 549.7 mm (21.64 inches), 561.3 mm (22.10 inches) – SAS/SATA or NVMe or E3.S or Universal configuration |
| Weight | 3.7 kg (8.15 pounds) |
| Embedded Management | IDRAC9 IDRAC Direct IDRAC RESTful API with Redfish IDRAC Service Module |
| OpenManage Software | CloudIQ for PowerEdge plugin OpenManage Enterprise OpenManage Enterprise integration for VMware Vcenter OpenManage Integration for Microsoft System Center OpenManage Integration with Windows Admin Center OpenManage Power Manager plugin OpenManage Service plugin OpenManage Update Manager plugin |
| Integrations | BMC Truesight Microsoft System Center OpenManage Integration with ServiceNow OpenManage Integration with Windows Admin Center OpenManage Power Manager plugin OpenManage Service plugin OpenManage Update Manager plugin |
| Security | AMD Secure Encrypted Virtualization (SEV) AMD Secure Memory Encryption (SME) Cryptographically signed firmware Data at Rest Encryption (SEDs with local or external key mgmt) Secure BootSecured Component Verification (Hardware integrity check) Secure Erase Silicon Root of Trust System Lockdown (Requires IDRAC9 Enterprise or Datacenter) TPM 2.0 FIPS, CC-TCG certified, TPM 2.0 China NationZ |
| Embedded NIC | 1 x 1 GBE |
| Rear Ports | 1 x USB 3.0 1 x IDRAC Ethernet port 1 x IDRAC Direct (Micro-AB USB) port 1 x Mini-DisplayPort |
| PCIE slots | Up to 2 x PCIe x16 Gen5 Low-Profile slots 1 x OCP 3.0 x16 Gen5 |
| Operating System and Hypervisors | Canonical Ubuntu Server LTS Microsoft Windows Server with Hyper-V Red Hat Enterprise Linux SUSE Linux Enterprise Server VMware ESXi/vSAN |
Build and Design
The Dell PowerEdge C6600 chassis and the C6615 nodes offer an exceptionally dense computing option for deployment scenarios that need to minimize the physical space used in a rack-mount environment. This is suitable for hyper-converged solutions operating in a clustered environment, requiring multiple nodes or compute-heavy workloads that do not necessitate the consumption of 4U or 8U through traditional 1U or 2U server designs. The chassis has a 2U footprint with a depth of 30 inches. The weight of the chassis can get up there depending on the final configuration. Dell lists a maximum weight of a 16-bay C6600 configuration with all drives installed at 93.69lbs.
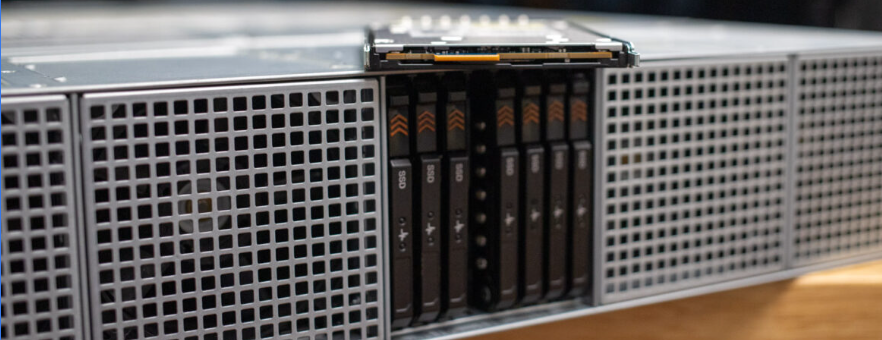
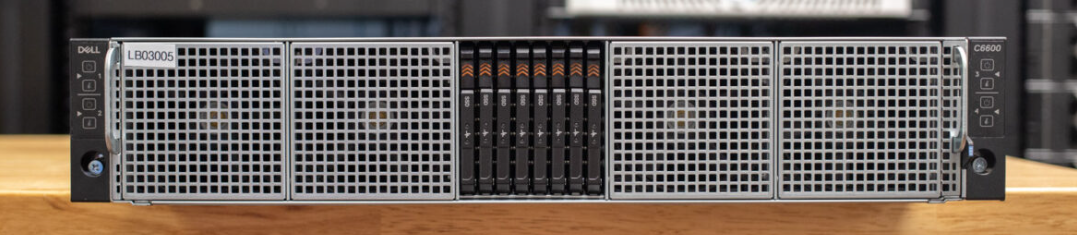
The front of the system is pretty basic compared to other PowerEdge platforms, without much Dell branding. This server type doesn’t offer the standard PowerEdge bezel but puts the drives and fan intakes front and center. The front of the E3.S C6600 build has eight Gen5 NVMe SSDs in the middle, flanked by cooling fan intakes.
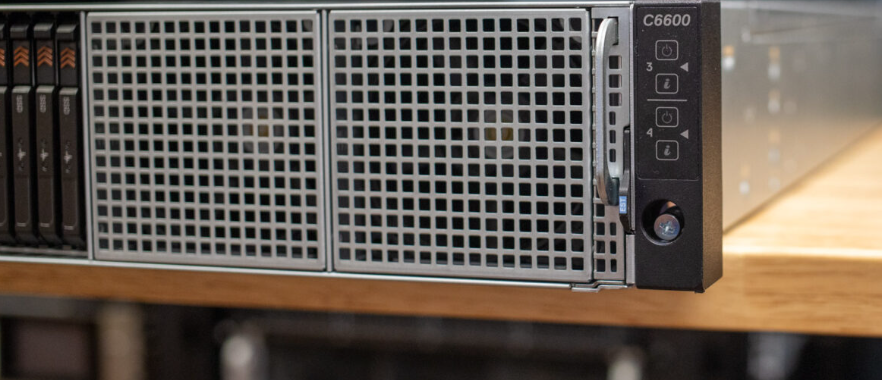
The chassis’s side ears contain dedicated power buttons for each node and info buttons indicating the status or problems of that node.
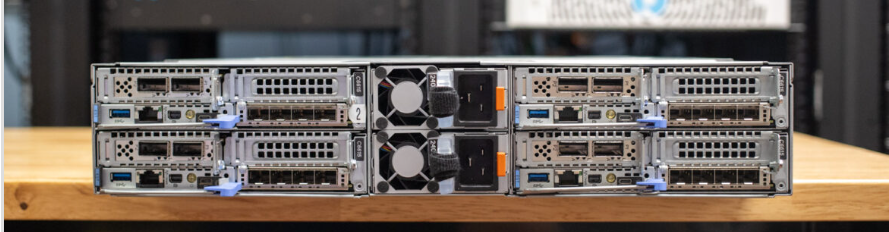
Each C6615 node has a condensed port layout at the rear of the chassis compared to a traditional 1U or 2U server. Ports include USB, iDRAC, a display connector, and a USB service port.
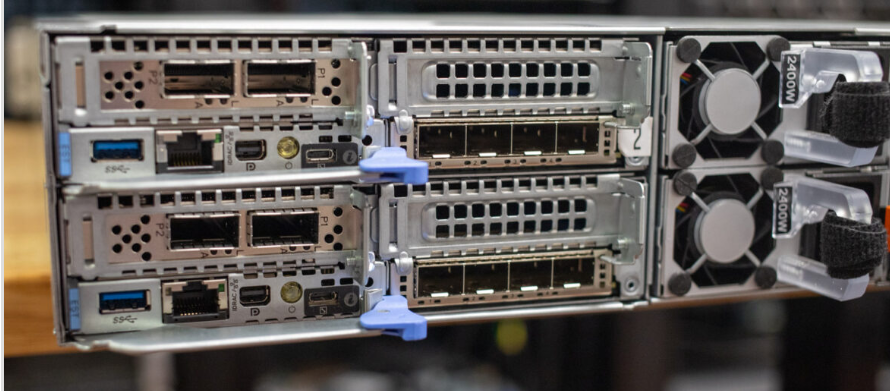
For networking, an OCP slot is available for different interface options (ours has a quad-port 25GbE NIC), and two PCIe slots are also available. Both the OCP and dual PCIe slots offer a Gen5 interface.
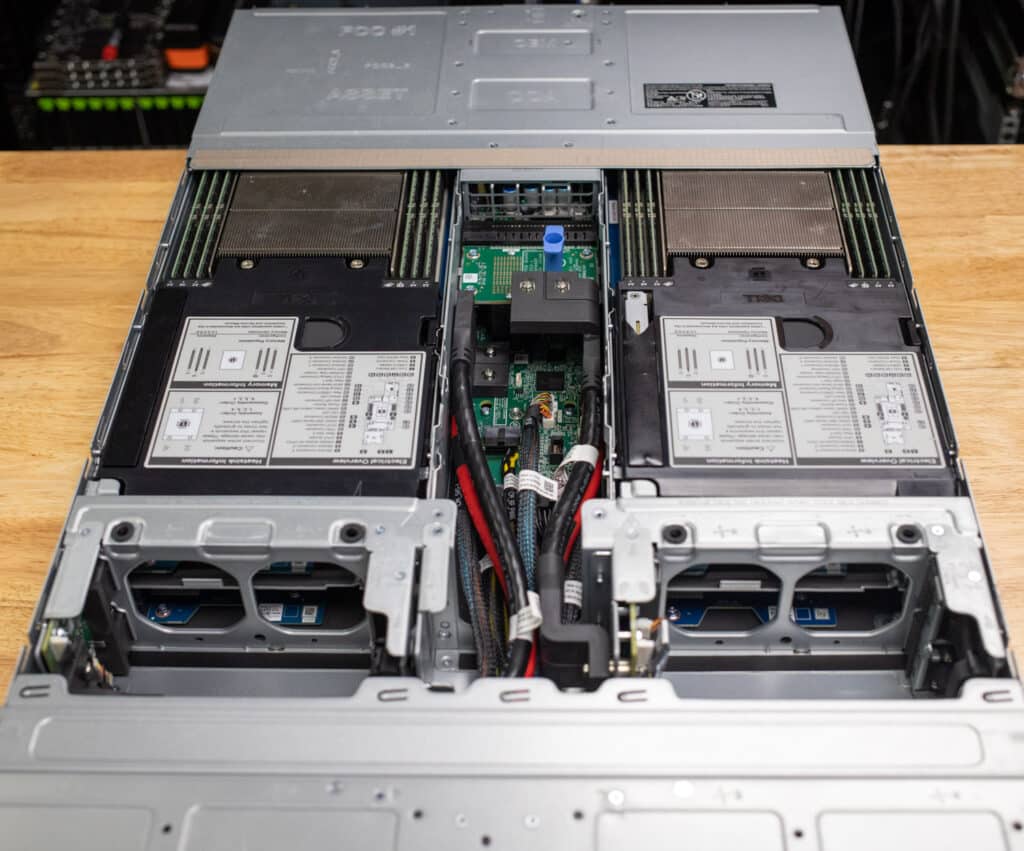
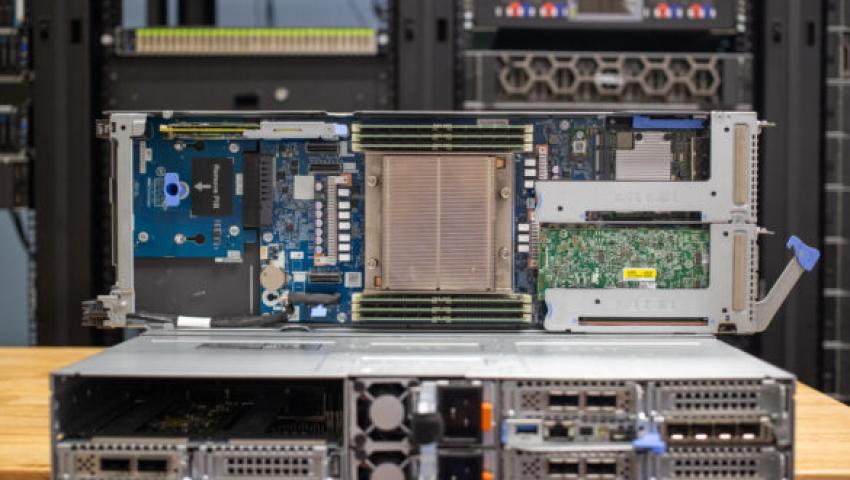
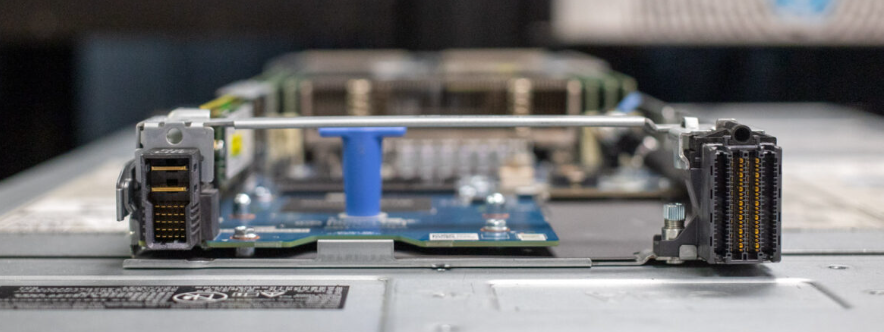
Opening up the PowerEdge C6600 chassis gives you visibility into the layout of how the cooling, power distribution, and drive I/O paths are handled. PCIe/SAS cabling from the drive backplane is routed directly to each node through quick-connect fittings that also pass data and power.
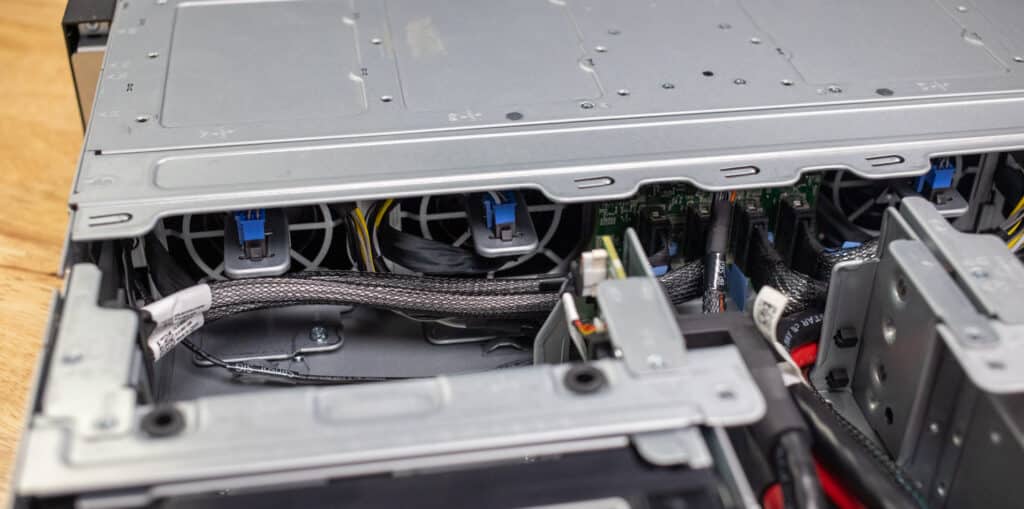
Depending on each node’s internal configuration, drive connections attach directly to the motherboard or a PERC card for hardware RAID options.
Other than cooling and power, the nodes do not share any other resources.
Dell PowerEdge C6615 Performance
Tested Node Specs
All four of our C6615 nodes have identical configurations. We will compare them and show the average performance across the nodes.
- 1 x AMD EPYC 8534P 64-Core CPU
- 6 x 96 GB DDR5 4800 MB/s (576 GB)
- Windows Server 2022 Standard
- Dell RAID1 BOSS Boot SSD
- 2 PCIe Gen5 E3.S SSDs
In our performance tests, the nodes were operated in parallel to give an aggregate score that considered the shared power and cooling resources.
Storage Performance
Each of the four Dell Power Edge C6615 nodes includes a BOSS RAID1 SSD for boot and two E3.S bays for Gen5 enterprise SSDs. While the BOSS card is no slouch, it offers a vastly different performance profile than the E3.S SSDs. Although much of this review will focus on the overall system-level performance, we lightly touched both storage types on this system with four-corner workloads. Our first test focused on the BOSS RAID1 boot SSD group.
| Dell BOSS RAID1 | Read Performance | Write Performance |
|---|---|---|
| Sequential 1MB Q32/4T | 2,963MB/s | 1,067MB/s |
| Random 4K Q32/8T | 600,786 IOPS (0.426ms) | 249,819 IOPS (1.024ms) |
Next, we looked at a single Gen5 E3.S SSD, which included the 7.68TB KIOXIA CM7 Read-Intensive SSD in our review system.
| KIOXIA 7.68TB CM7-R | Read Performance | Write Performance |
|---|---|---|
| Sequential 1MB Q32/4T | 13,736MB/s | 7,089MB/s |
| Random 4K Q32/8T | 931,671 IOPS (0.266ms) | 768,739 IOPS (0.329ms) |
Cinebench R23
Maxon’s Cinebench R23 is a CPU rendering benchmark that utilizes all CPU cores and threads. We ran it for both multi- and single-core tests. Higher scores are better. Here are the results for all the EPYC chips.
In Cinebench R23, all four nodes sat around the high side of 74,000 on the multi-core portion, with node 3 creeping into 75,000. All four nodes stayed much closer for single-core scores, with nodes 1 and 4 at 1,088. Node 3 was only 8 points behind, and node 2 was 5 points ahead. Overall, all the nodes only had minor performance gaps, typical across different CPUs, even though they are all the same model.
| Cinebench R23 | Node 1 | Node 2 | Node 3 | Node 4 | Average |
|---|---|---|---|---|---|
| CPU Multi-Core | 74,877 | 74,961 | 75,011 | 74,745 | 74,898.5 |
| CPU Single-Core | 1,088 | 1,093 | 1,084 | 1,088 | 1,088.25 |
| MP Ratio | 64.84 | 68.60 | 69.17 | 68.70 | 67.83 |
Cinebench 2024
Maxon’s Cinebench 2024 is a CPU and GPU rendering benchmark that utilizes all CPU cores and threads. We ran it for both multi- and single-core tests. Since these nodes don’t have GPUs, we only have the multi- and single-core numbers.
In Cinebench 2024, all the nodes remained close together, with minimal variance on both the multi-core and single-core portions. Average performance was 4,509 points for multi-core and 67.25 points for Single-Core, with an MP Ratio of 66.98.
| Cinebench 2024 | Node 1 | Node 2 | Node 3 | Node 4 | Average |
|---|---|---|---|---|---|
| CPU Multi-Core | 4,544 | 4,577 | 4,436 | 4,481 | 4,509.5 |
| CPU Single-Core | 68 | 68 | 65 | 68 | 67.25 |
| MP Ratio | 66.79 | 67.23 | 68.21 | 65.69 | 66.98 |
Geekbench 6 CPU
Geekbench 6 is a cross-platform benchmark that measures overall system performance. This test includes a CPU test portion and a GPU test portion, but as these nodes do not have GPUs, we only have CPU Numbers. Higher scores are better.
In Geekbench, we saw tight numbers until we got to node 3, which fell back slightly on single- and multi-core. The average between all nodes was 1,687 on single-core and 19,319.5 on multi-core.
| Geekbench 6 CPU | Node 1 | Node 2 | Node 3 | Node 4 | Average |
|---|---|---|---|---|---|
| Single-Core | 1,707 | 1,708 | 1,625 | 1,708 | 1,687 |
| Multi-Core | 19,544 | 19,234 | 18,999 | 19,501 | 19,319.5 |
Blender 4.0 CPU
Next up is Blender OptiX–an open-source 3D modeling application. This benchmark was run using the Blender Benchmark CLI utility. The score is samples per minute, with higher being better.
The C6615 nodes saw pretty consistent numbers. The average scores were 591.79 on Monster, 415.88 on Junkshop, and 311.74 on Classroom.
| Blender 4.0 CPU | Node 1 | Node 2 | Node 3 | Node 4 | Average |
|---|---|---|---|---|---|
| Monster | 595.23 | 593.51 | 584.35 | 594.07 | 591.79 |
| Junkshop | 415.26 | 415.11 | 418.05 | 415.08 | 415.88 |
| Classroom | 308.57 | 312.91 | 312.69 | 312.78 | 311.74 |
Blender 4.1 CPU
Blender OptiX 4.1 brings new features, such as GPU-accelerated denoising, streamlining the rendering process, and decreasing the time needed for denoising tasks. Despite these advancements, the overall performance improvements in benchmark scores over version 4.0 are minimal, indicating only slight enhancements in efficiency.
Again, we see consistent numbers across the board, with averages of 587.22 on Monster, 420.20 on Junkshop, and 306.60 on Classroom.
| Blender 4.1 CPU | Node 1 | Node 2 | Node 3 | Node 4 | Average |
|---|---|---|---|---|---|
| Monster | 590.46 | 590.58 | 584.76 | 583.08 | 587.22 |
| Junkshop | 418.38 | 416.71 | 426.73 | 419.03 | 420.20 |
| Classroom | 306.86 | 304.81 | 308.95 | 305.79 | 306.60 |
7-Zip Compression
The popular 7-Zip utility has a built-in memory benchmark that demonstrates CPU performance. In this test, we run it against a 128 MB dictionary size when possible.
Fair scores were seen across all nodes. In the total rating scores, we saw 5,778.75% total CPU usage, 4.355 GIPS Total Rating/Usage, and 252 GIPS Total Rating.
| Blender 4.1 CPU | Node 1 | Node 2 | Node 3 | Node 4 | Average |
|---|---|---|---|---|---|
| Compressing | |||||
| Current CPU Usage | 5,548% | 5,549% | 5,633% | 5,585% | 5,578.75% |
| Current Rating / Usage | 4.256 GIPS | 4.210 GIPS | 4.156 GIPS | 4.177 GIPS | 4.20 GIPS |
| Current Rating | 236.158 GIPS | 233.626 GIPS | 234.092 GIPS | 233.285 GIPS | 234.290 GIPS |
| Resulting CPU Usage | 5,536% | 5,537% | 5,601% | 5,553% | 5,556.75% |
| Resulting Rating / Usage | 4.193 GIPS | 4.202 GIPS | 4.172 GIPS | 4.168 GIPS | 4.184 GIPS |
| Resulting Rating | 232.118 GIPS | 232.631 GIPS | 233.691 GIPS | 231.443 GIPS | 232.470 GIPS |
| Decompressing | |||||
| Current CPU Usage | 5,973% | 6,027% | 5,992% | 6,014% | 6,001.5% |
| Current Rating / Usage | 4.543 GIPS | 4.501 GIPS | 4.565 GIPS | 4.509 GIPS | 4.530 GIPS |
| Current Rating | 271.343 GIPS | 271.287 GIPS | 273.507 GIPS | 271.196 GIPS | 271.833 GIPS |
| Resulting CPU Usage | 5,997% | 6,015% | 5,999% | 5,990% | 6,000.25% |
| Resulting Rating / Usage | 4.537 GIPS | 4.519 GIPS | 4.550 GIPS | 4.499 GIPS | 4.526 GIPS |
| Resulting Rating | 272.066 GIPS | 271.775 GIPS | 272.946 GIPS | 269.509 GIPS | 271.574 GIPS |
| Total Rating | |||||
| Total CPU Usage | 5,767% | 5,776% | 5,800% | 5,772% | 5,778.75% |
| Total Rating / Usage | 4.365 GIPS | 4.360 GIPS | 4.361 GIPS | 4.333 GIPS | 4.355 GIPS |
| Total Rating | 252.092 GIPS | 252.203 GIPS | 253.318 GIPS | 250.476 GIPS | 252.022 GIPS |
Blackmagic Raw Speed Test
We have been utilizing Blackmagic’s Raw Speed Test to evaluate how machines do real-world RAW decoding. This test can incorporate both CPU and GPU usage, but we will only be testing the CPU usage.
All four nodes exhibited extremely close performance, averaging 119.75 FPS.
| Blackmagic Raw Speed Test | Node 1 | Node 2 | Node 3 | Node 4 | Average |
|---|---|---|---|---|---|
| 8K CPU | 121 FPS | 121 FPS | 118 FPS | 119 FPS | 119.75 FPS |
Blackmagic Disk Speed Test
Next is the Blackmagic Disk Speed Test. This test runs a 5 GB sample file for read and write speeds. As it is single-threaded, it won’t show the highest speeds from the disk, but it still gives a good perspective.
The C6615s have a BOSS card inside, utilizing dual M.2 drives in RAID1, so performance is slightly degraded for reliability. For Write speeds, we saw an average of 991.6 MB/s, and for Read speeds, an average of 2,801 MB/s.
| Blackmagic Disk Speed Test | Node 1 | Node 2 | Node 3 | Node 4 | Average |
|---|---|---|---|---|---|
| Write | 999.8 MB/s | 977.4 MB/s | 991.4 MB/s | 997.7 MB/s | 991.6 MB/s |
| Read | 2,807.4 MB/s | 2,790.1 MB/s | 2,828.0 MB/s | 2,780.4 MB/s | 2,801.5 MB/s |
Y Cruncher
y-cruncher is a multi-threaded and scalable program that can compute Pi and other mathematical constants to trillions of digits. Since its launch in 2009, it has become a popular benchmarking and stress-testing application for overclockers and hardware enthusiasts.
For our average speeds, we saw 9.5 seconds for 1 Billion, 24.20 seconds for 2.5 Billion, and 50.73 Seconds for 5 Billion. On the more significant digit computations, we saw 105.73 Seconds for 10 Billion, 288.85 seconds for 25 Billion, and 633.5 seconds for 50 Billion.
| Y Cruncher (Total Computation Time, in seconds) | Node 1 | Node 2 | Node 3 | Node 4 | Average |
|---|---|---|---|---|---|
| 1 Billion | 9.587 | 9.459 | 9.350 | 9.633 | 9.507 |
| 2.5 Billion | 24.490 | 24.225 | 23.334 | 24.740 | 24.197 |
| 5 Billion | 51.427 | 50.990 | 49.303 | 51.214 | 50.734 |
| 10 Billion | 107.084 | 107.646 | 103.772 | 107.443 | 105.736 |
| 25 Billion | 291.918 | 290.944 | 280.632 | 291.902 | 288.849 |
| 50 Billion | 641.709 | 640.289 | 619.100 | 640.917 | 635.504 |
UL Procyon AI Computer Vision Benchmark
UL Procyon AI Inference is designed to gauge a workstation’s performance in professional applications. It should be noted that this test does not take advantage of multiple CPU capabilities. Specifically, this tool benchmarks the workstation’s ability to handle AI-driven tasks and workflows, providing a detailed assessment of its efficiency and speed in processing complex AI algorithms and applications.
For this test, we are utilizing Procyon V2.7.0. In this test, lower times are better. Across the nodes, the averages were 3.91ms on MobileNet V3, 8.4.0 ms for Resnet50, and 29.47ms. On the rest of the scores, we saw 30.96ms on DeepLab V3, 44.68ms on YOLO V3, and 2008.65ms on Real-ESRGAN. For the Overall score, the nodes averaged 133.5.
| UL Procyon Computer Vision (Average Inference Time) | Node 1 | Node 2 | Node 3 | Node 4 | Average |
|---|---|---|---|---|---|
| MobileNet V3 | 3.87 ms | 3.94 ms | 3.84 ms | 4.00 ms | 3.91 ms |
| ResNet50 | 8.47 ms | 8.45 ms | 8.23 ms | 8.46 ms | 8.40 ms |
| Inception V4 | 29.76 ms | 29.55 ms | 28.74 ms | 29.84 ms | 29.47 ms |
| DeepLab V3 | 30.39 ms | 30.21 ms | 33.18 ms | 30.07 ms | 30.96 ms |
| YOLO V3 | 44.71 ms | 44.58 ms | 44.79 ms | 44.63 ms | 44.68 ms |
| Real-ESRGAN | 2003.18 ms | 1971.97 ms | 2018.26 ms | 2041.18 ms | 2008.65 ms |
| Overall Score | 134 | 134 | 133 | 133 | 133.5 |
Conclusion
The Dell PowerEdge C6615 nodes offer a single AMD EPYC CPU with up to 64 cores and six DDR5 slots that support 96GB DIMMs. The C6600 chassis that houses these nodes offers a few storage configurations. Our review system has the 8x E3.S Gen5 SSD backplane. In the C6600 design, each node gets access to two of these SSDs; the chassis just provides power and direct cabled access to the drives. For management, each C6615 offers iDRAC; the chassis doesn’t have any dedicated management.
We independently assessed each C6615 node’s capabilities in our performance testing and averaged the scores across all four to identify performance anomalies. The performance data highlights that the nodes perform consistently, with no outliers or uneven performance. This predictability is key for service providers and hyperscale customers who can benefit from dense systems like this.
We found the system well-designed for its intended use case; our only complaint is the relatively limited Gen5 SSD support—just two drives per node. Dell would likely suggest that compute-dense customers don’t require that much local storage and cooling more Gen5 drives is a serious technical challenge, and they’re probably right, we just prefer more drives than fewer at almost every opportunity. One other note that’s worth mentioning, we’re reviewing the C6615 here, but as indicated at the top of this review, Dell does offer additional node types for this platform, the Intel-based C6620 comes in a liquid-cooled version, which some may find compelling.
The Dell PowerEdge C6615 compute nodes give service providers an amazing combination of performance per rack U. We’ve seen plenty of 2U4N configurations before, but this design allows for more width, and thus expansion flexibility, in each server than many competing systems. Couple the great design with management software like iDRAC and OpenManage Enterprise and we’re big fans of the end result.
Pho Tue SoftWare Solutions JSC
Pho Tue SoftWare Solutions JSC là Nhà Cung cấp dịch Trung Tâm Dữ Liệu, Điện Toán Đám Mây Và Phát Triển Phần Mềm Hàng Đầu Việt Nam. Hệ Thống Data Center Đáp Ứng Mọi Nhu Cầu Với Kết Nối Internet Nhanh, Băng Thông Lớn, Uptime Lên Đến 99,99% Theo Tiêu Chuẩn TIER III-TIA 942.
Để lại bình luận
Địa chỉ email của bạn sẽ không được công khai. Các trường bắt buộc được đánh dấu *